OpenTelemetry Mongodb Instrumentation allows the user to automatically collect trace data and export them to the backend of choice (we can use Zipkin or Jaeger for this example), to give observability to distributed systems.
This is a modification of the Mongo example that executes multiple parallel requests that interact with a Mongodb server backend using the mongo npm module. The example displays traces using multiple connection methods.
- Create Collection Query
- Insert Document Query
- Fetch All Documents Query
# from this directory
npm install
Setup Zipkin Tracing or Setup Jaeger Tracing
-
Start MongoDB server in docker
# from this directory npm run docker:start -
Run the server
# from this directory npm run zipkin:server -
Run the client
# from this directory
npm run zipkin:client
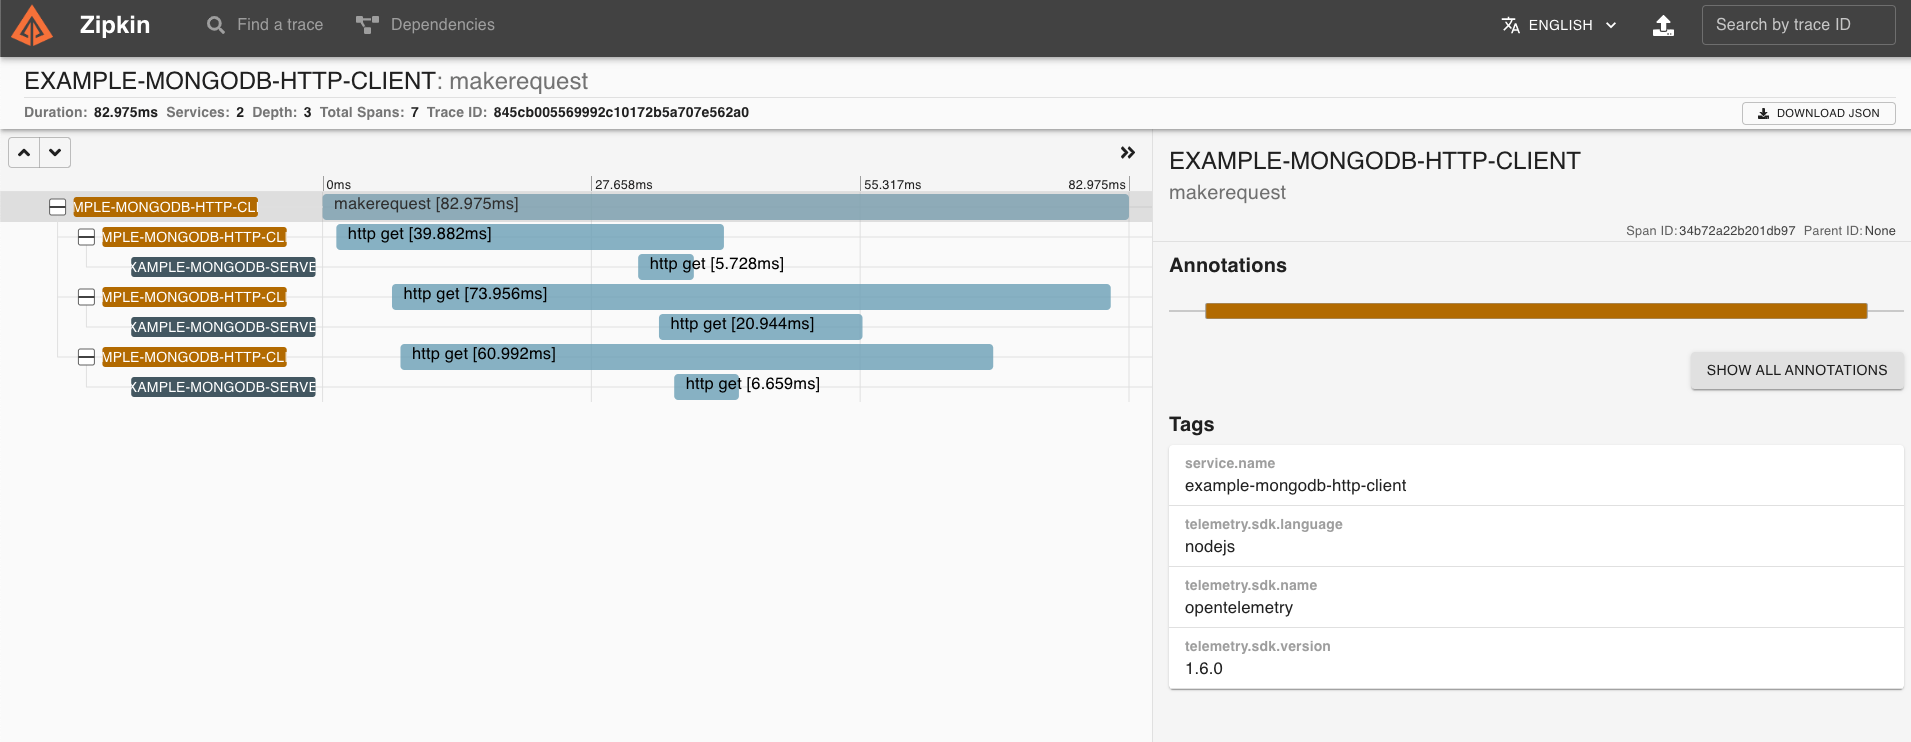
After a short time, the generated traces should be available in the Zipkin UI. Visit http://localhost:9411/zipkin and click the "RUN QUERY" button to view recent traces, then click "SHOW" on a given trace.
-
Start MongoDB server via docker
# from this directory npm run docker:start -
Run the server
# from this directory npm run jaeger:server -
Run the client
# from this directory
npm run jaeger:client
Visit the Jaeger UI at http://localhost:16686/search, select a service (e.g. "example-express-client"), click "Find Traces", then click on a trace to view it.

- For more information on OpenTelemetry, visit: https://opentelemetry.io/
- For more information on OpenTelemetry for Node.js, visit: https://github.com/open-telemetry/opentelemetry-js/tree/main/packages/opentelemetry-sdk-trace-node
Apache License 2.0