Skip to content
New issue

Have a question about this project? Sign up for a free GitHub account to open an issue and contact its maintainers and the community.

By clicking “Sign up for GitHub”, you agree to our terms of service and privacy statement. We’ll occasionally send you account related emails.

Already on GitHub? Sign in to your account

A problem about relation between "openblas_set_num_threads" and CPU waste and time cost? #1544

Closed
sunbinbin1991 opened this issue May 4, 2018 · 13 comments

Comments

@sunbinbin1991
Copy link

sunbinbin1991 commented May 4, 2018

First, I will introduce ,my background. I have to accelerate a matrix calculation. My hardware is RK3288 which have four Quad-Core Cortex-A17 cpu. When I use it by default,
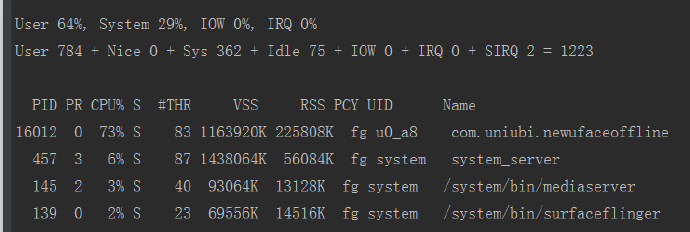
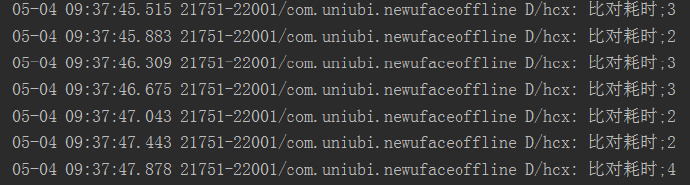
it is waste much more time to calculate, and waste much CPU,as below,

cpu cost:

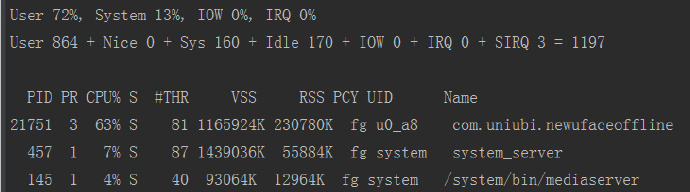
however, when I set the openblas_num_threads,like this:
openblas_set_num_threads(1);
I found, it waste not much time and CPU waste is much lower,as below,

cpu cost:

clearly, waste time and cpu waste both reduced. So, what happen for this problem?

@martin-frbg
Copy link
Collaborator

I suspect without setting the number of threads it will try to use all four cores, causing conflicts with the other processes on your system (leading to rescheduling and invalidating caches). How is the performance with 2 or 3 threads (leaving one core for everybody else) ? It could also be that one of the OpenBLAS functions you use is needlessly trying to parallelize its workload, so it might be useful to know which functions you are calling, and how big your matrix sizes are.

@sunbinbin1991
Copy link
Author

sunbinbin1991 commented May 4, 2018

@martin-frbg Thanks for your quick reply. I print default openblas_num_thread is 4. I have make a try. When I use 2 or 3 threads, the performance it similar like thread 4. CPU and time waste is still much higher.Here is function I used:
const int inc_x = 1;
const int inc_y = 1;
const float alpha = 1.0f;
const float beta = 0.0f;
cblas_sgemv(CblasRowMajor, CblasNoTrans, features_in_lib, featurelen, alpha, (float *) features.data(), featurelen, feature_to_compare, 1, beta, scores, inc_y);
And my matrix is about is about : features * feature_to_compare here, 6000 * 128 (features),128 * 1(feature_to_compare )

@martin-frbg
Copy link
Collaborator

martin-frbg commented May 4, 2018

There are two old tickets on sgemv performance compared to other BLAS implementations that were never conclusively solved (mostly from lack of data it seems), #532 and #821. On the other hand, the
GEMM threading algorithm was changed since the last release (PRs #1316 and #1320),
which version of OpenBLAS are you using - the 0.2.20 release or the current develop branch from git ?

@sunbinbin1991
Copy link
Author

I just pull a version of openblas about Dec,2017, not a release version

@martin-frbg
Copy link
Collaborator

Actually my recollection was wrong, the two PRs I mentioned did not affect GEMV at all, sorry.

@brada4
Copy link
Contributor

brada4 commented May 5, 2018

Could you try to record source of waste with 'perf record' and 'perf report' and paste top page from later?
Also note that some spectre patches rewrite user mode codes and rob half of speed, best to recompile with spectre-aware gcc to run on patched kernel, to have nop sled in places to be live-patched.

@martin-frbg
Copy link
Collaborator

martin-frbg commented May 20, 2018

Running sgemv.goto 5000 6000 1000 from the benchmarks directory on an Asus Tinkerboard, i get:

THREADS           1                            2                     3                     4
5000x5000 344.05 MFlops 0.145s    417.69 MFlops 0.119s  558.78 MFlops 0.089s   624.05 MFlops  0.08s
6000x6000 312.73 MFlops 0.230s    432.10 MFlops 0.167s  532.67 MFlops 0.135s   576.67 MFlops  0.125s
10k x 10k 197.60 MFlops 1.012s    321.13 MFlops 0.622s  431.11 MFlops 0.463s  514.34 MFlops 0.389s
15k x 15k 147.25 MFlops 3.055s    257.74 MFlops 1.745s  356.05 MFlops 1.263s  437.21 MFlops 1.03s 

the perf report for this benchmark is dominated by the calls to random() used to set up the matrix, but at least the mutex lock/unlock calls seem to make an insignificant contribution compared to the gemv kernel operations. Due to the fixed 2GB memory of the tinkerboard, the upper limit for the matrix size is around 21000x21000. perf stat does not provide much additional insight, need to rerun this with a matrix of ones to eliminate the calls to random() that may be driving the number of context switches.
"cpu migrations" as another cost factor turned out to be not influenced by building without the default NO_AFFINITY=1, will need to try taskset for this.
Hardware issues may play a role as well, assuming that insufficient cooling may cause the cpus to throttle down. At least I noticed that I could easily crash the tinkerboard (with just its included small heatsink) by trying to do the default parallel build... (Edit: tinkerboard problem solved by better power supply)

@sunbinbin1991
Copy link
Author

Thanks for your kind reply @martin-frbg . Actually,time cost is real have much influence for me. I want to use much small cpu waste because my limit of my hardware, so Is there some parameters for me to reduce cpu waste? Need I have rebuild it?

@martin-frbg
Copy link
Collaborator

I did not find a problem with the test, perhaps there is something special about your program that makes it behave differently than the gemv.goto benchmark.
Do you see the same problem when you try sgemv.goto 21000 21000 1 like I did ? (You need to run make in the benchmark directory first to get it)

@martin-frbg
Copy link
Collaborator

I do not see anything suspicious with xianyi's dgemv test case from #532 (comment) either (running with either "6000 128" or "128 6000" for 1000 iterations each). Unlikely that using cblas_sgemv instead of sgemv adds that much overhead to cause your problem. Perhaps retry with current 0.3.0 release ?

@xsacha
Copy link
Contributor

xsacha commented Jun 16, 2018

I think the difference is from when you cross compile. Did you cross compile for test on tinker board?

@martin-frbg
Copy link
Collaborator

Good point, I compile locally. (I do see an improvement now with oon3m0oo's recent commit that cleaned up the memory initialization on thread startup, so sunbinbin1991 may want to try the current develop tree now if he is still interested)

@sunbinbin1991
Copy link
Author

sunbinbin1991 commented Jun 27, 2018

As for my problem, most of possible reason is limitation of my hardware. In my project not only openblas is running, also, some other application is still on, maybe this is reason when I use "multi-thread" could waste much more time. Actually, even “openblas_set_num_threads = 1“, my matrix calculate is waste less than 1ms, that's enough for me.
I rebuild a new one, for "sgemv", “openblas_set_num_threads = 4“ is better than “openblas_set_num_threads = 1",
here is my hardware infomation:

cpu: 88 Intel(R) Xeon(R) CPU E5-2696 v4 @ 2.20GHz

here is my result:

10000x512x1 0.008620 s 1187.935059 MFLOPS thread = 1
10000x512x1 0.005167 s 1981.807617 MFLOPS thread = 2
10000x512x1 0.003739 s 2738.700195 MFLOPS thread = 4
10000x512x1 0.002862 s 3577.917480 MFLOPS thread = 8
10000x512x1 0.002209 s 4635.581543 MFLOPS thread = 16

Sign up for free to join this conversation on GitHub. Already have an account? Sign in to comment
Labels
None yet
Projects
None yet
Development

No branches or pull requests

4 participants