DATA VIZ: Fix bugs, incorrect string and null displays #871
Conversation
This file contains bidirectional Unicode text that may be interpreted or compiled differently than what appears below. To review, open the file in an editor that reveals hidden Unicode characters.
Learn more about bidirectional Unicode characters
Pull Request Test Coverage Report for Build 3374
💛 - Coveralls |
|
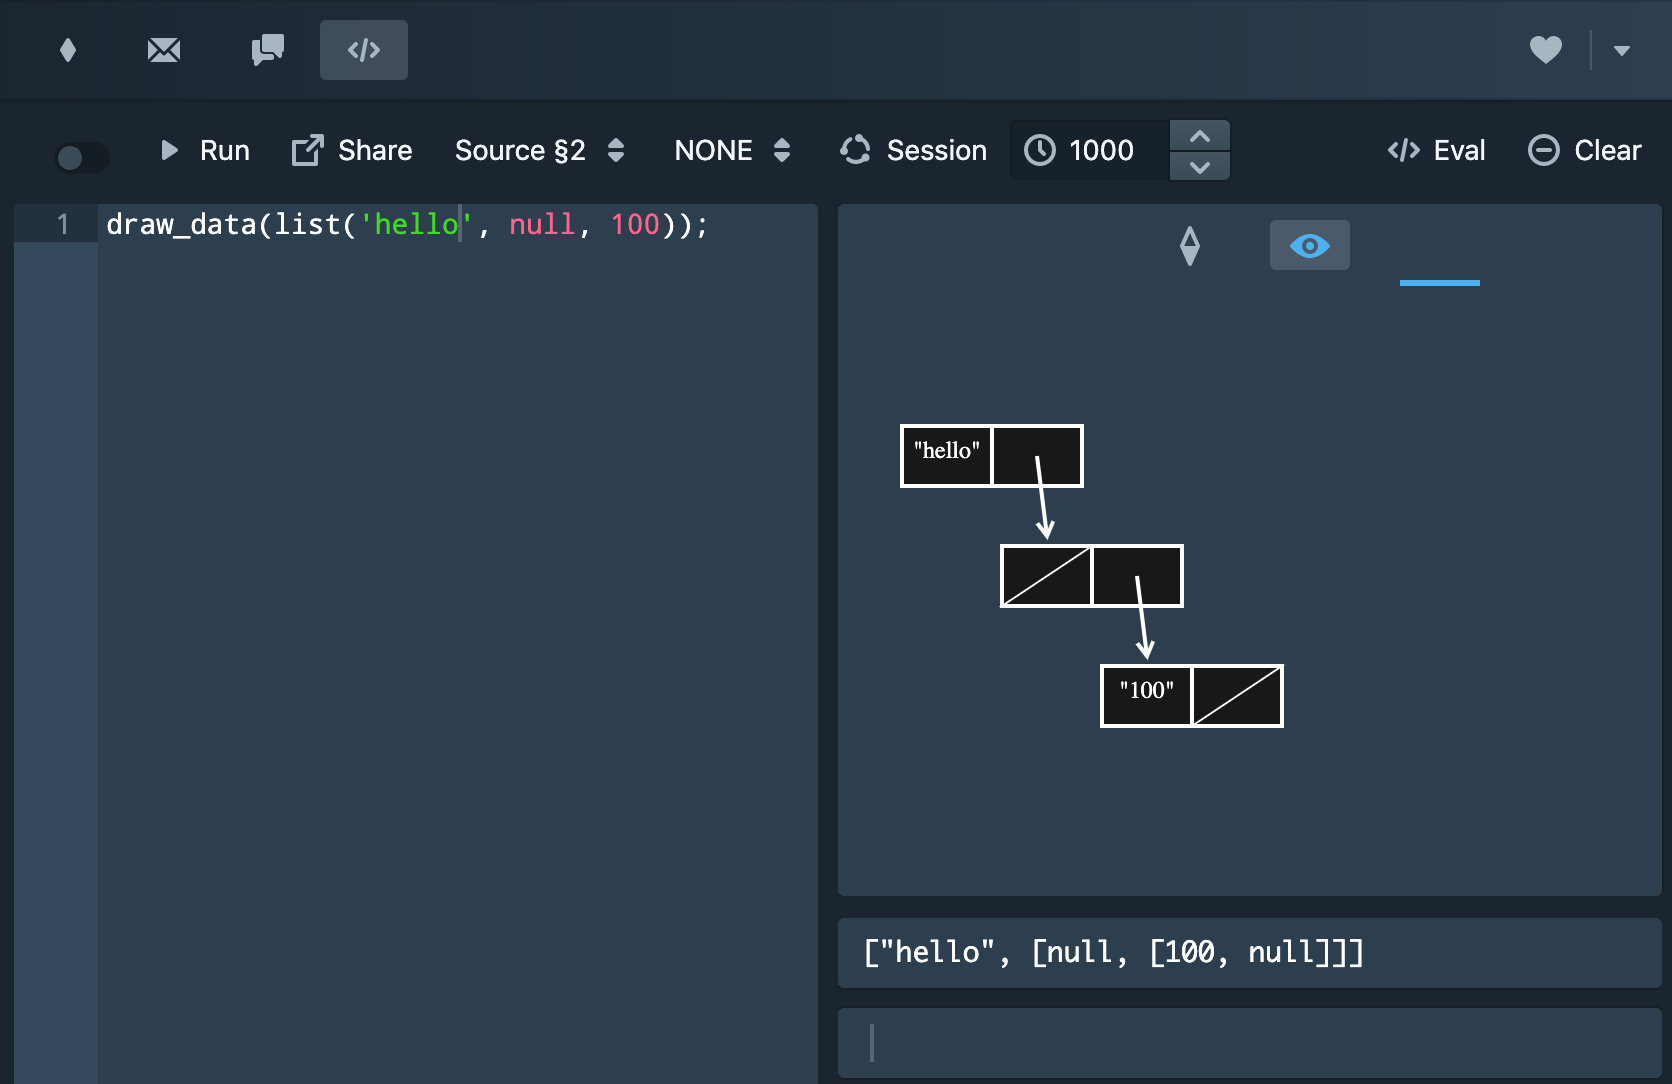
Still not quite right: Now numbers appear as strings:
|
Oops! Fixed now. |
|
I'm getting |
|
Can you add the relevant functions that were removed from this commit |
martin-henz
approved these changes
Sep 2, 2019
|
Some more tests I performed... const ebst = make_empty_tree();
const bstll = make_tree(4, ebst, ebst);
const bstlr = make_tree(5, ebst, ebst);
const bstrl = make_tree(6, ebst, ebst);
const bstrr = make_tree(7, ebst, ebst);
const bstl = make_tree(2, bstll, bstlr);
const bstr = make_tree(3, bstrl, bstrr);
const bst = make_tree(1, bstl, bstr);
draw_data(bst);results in:
Note the non-uniform padding of the image. const ist = list(1, "abc", x => x, pair(1,2), null, "superlongstring", 1234567890);
draw_data(ist);results in:
Note the The data viz component doesn't resize together with the parent component (see below).
It seems like the component has a fixed window height? If the window is overflowed, it would result in 2 scroll bars!!!
|


|
Merging due to regression issues |
wltan
pushed a commit
to Source-Academy-Game/cadet-frontend
that referenced
this pull request
Feb 19, 2020
…y#871)

* Fix bugs, incorrect string and null displays

* Fix numbers not displaying correctly

* Fix data visualizer breaking
Sign up for free
to join this conversation on GitHub.
Already have an account?
Sign in to comment
Add this suggestion to a batch that can be applied as a single commit.
This suggestion is invalid because no changes were made to the code.
Suggestions cannot be applied while the pull request is closed.
Suggestions cannot be applied while viewing a subset of changes.
Only one suggestion per line can be applied in a batch.
Add this suggestion to a batch that can be applied as a single commit.
Applying suggestions on deleted lines is not supported.
You must change the existing code in this line in order to create a valid suggestion.
Outdated suggestions cannot be applied.
This suggestion has been applied or marked resolved.
Suggestions cannot be applied from pending reviews.
Suggestions cannot be applied on multi-line comments.
Suggestions cannot be applied while the pull request is queued to merge.
Suggestion cannot be applied right now. Please check back later.
nullslash in head of pair not displaying